
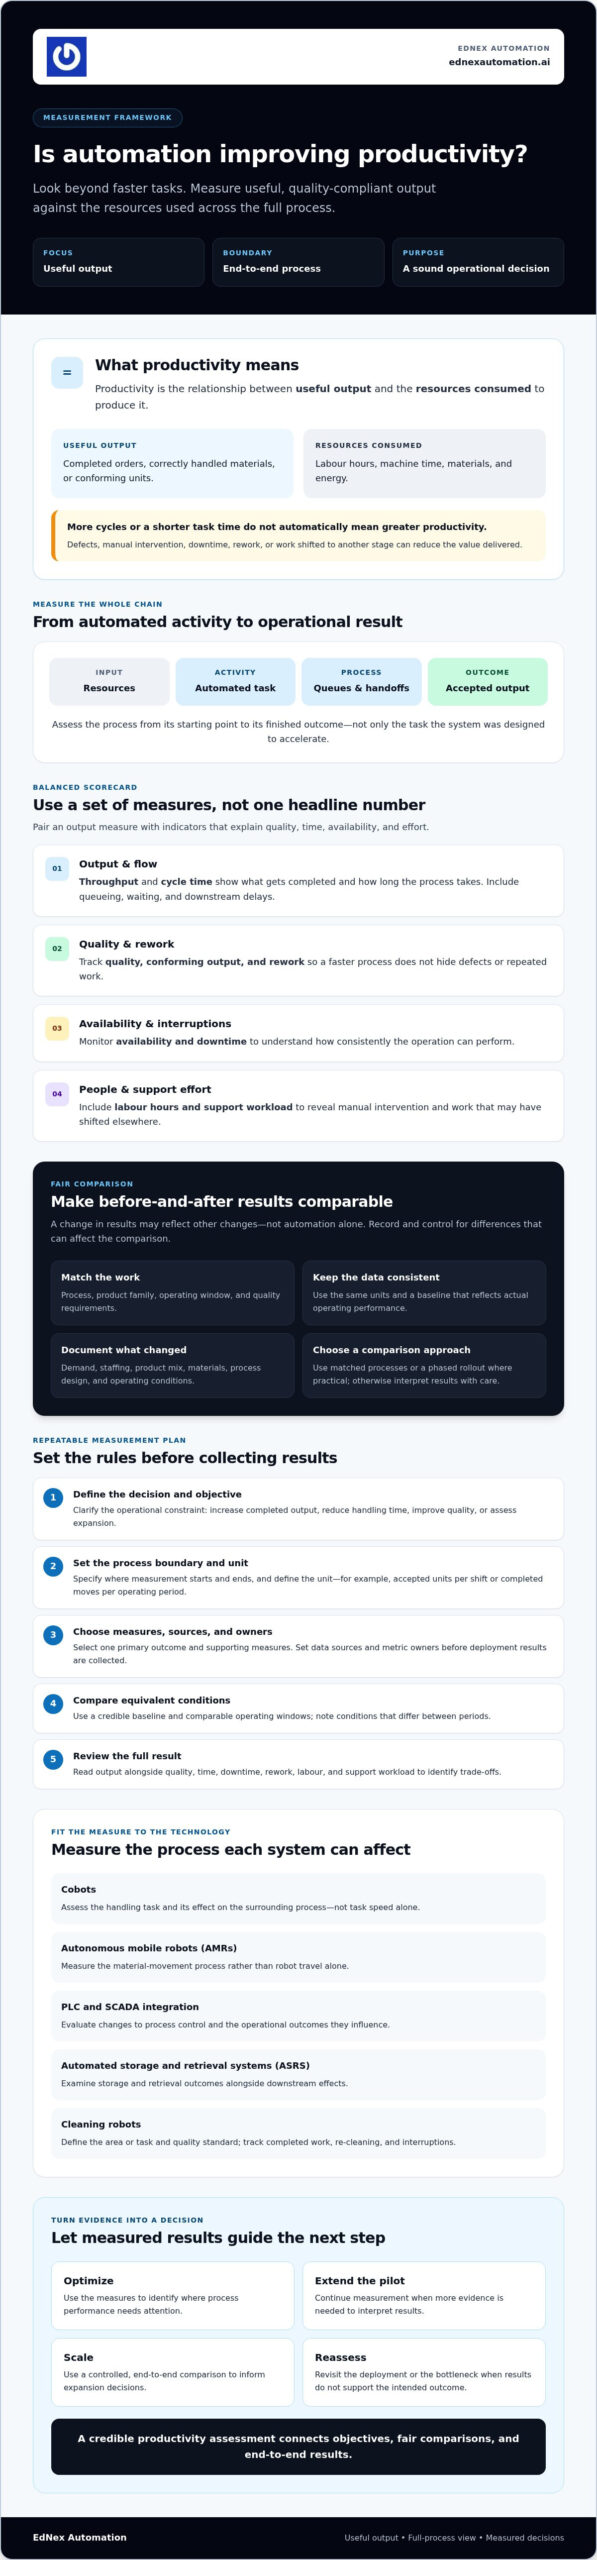
A faster cycle time can hide a less productive operation. If automation increases output but also adds downtime, rework, or support work, the headline gain may not reflect the value delivered. Measuring the impact of automation on productivity means evaluating the full process, not just the task a system was designed to accelerate.
Before-and-after figures can be useful, but they may mislead if teams use inconsistent data or overlook changes in demand, staffing, product mix, or operating conditions. A credible assessment starts with a baseline that reflects how the operation actually performs and metrics that connect to its objectives.
This guide explains how to set a fair comparison period, choose meaningful measures of output, quality, efficiency, downtime, and support workload, and account for factors beyond automation. It also shows how measurement needs vary across cobots, autonomous mobile robots, PLC and SCADA integration, and automated storage and retrieval systems. With a controlled, end-to-end comparison, decision-makers can determine whether to optimize, extend a pilot, scale, or reassess a deployment.
Key Takeaways
- Define productivity as useful output relative to resources consumed, and distinguish task-level speed from end-to-end operational results.
- Combine throughput, cycle time, availability, quality, rework, and labour hours to reveal trade-offs a single metric can miss.
- Strengthen comparisons by matching process, product family, operating window, and quality requirements; use phased rollouts where practical.
- Make measuring the impact of automation on productivity repeatable by setting objectives, data sources, and metric owners before collecting deployment results.
- Use the evidence to decide whether to optimize, extend a pilot, scale, or reassess, then evaluate technology against the measured bottleneck.
What does measuring automation’s impact on productivity actually mean?
Productivity describes the relationship between useful output and the resources consumed to produce it. In an automated operation, output might be completed orders, correctly handled materials, or conforming units. Resources may include labour hours, machine time, materials, and energy. A system running more cycles does not automatically make the operation more productive if those cycles create defects, require manual intervention, or shift work to another stage.
Automation activity is what a system does; measurable productivity impact is the change in useful, quality-compliant output relative to the resources consumed by the full process. This distinction matters because task-level speed captures only part of the result. A cobot may shorten a handling task, an AMR may move materials between locations, and PLC and SCADA integration may change process control. Each can affect different stages, so assess the process from its starting point to its finished outcome, not just the automated task.
This broader view also helps explain the Productivity paradox, the economic concept that investment in technology does not always produce a clear, immediate productivity gain. Measurement choices, implementation effects, and wider process changes can all shape what the data shows.
Which productivity question should the measurement answer?
Start with the operational constraint or decision. Is the goal to increase completed output, reduce handling time, improve quality, or decide whether a deployment should be expanded? Define the process boundary and unit of analysis, such as accepted units per shift or completed moves per operating period. Record product mix, shift pattern, and quality requirements so comparisons use equivalent conditions. Then choose one primary outcome and use measures such as downtime or rework to explain it.
The right boundary depends on the technology. For an AMR, measure the material-movement process rather than robot travel alone. For ASRS, examine storage and retrieval outcomes alongside downstream effects. For a cleaning robot, define the area or task to be completed and the quality standard, then track completed work, re-cleaning, and interruptions. A well-defined question keeps the assessment focused on an operational decision rather than a dashboard of disconnected activity figures.
Why is a before-and-after comparison not enough?
A post-deployment improvement can coincide with changes in staffing, demand, materials, or process design. Seasonality may alter workload, while a shift toward simpler products can raise apparent throughput without changing underlying capability. Compare equivalent operating windows and consistent units, and document meaningful differences between periods. Otherwise, the comparison may attribute to automation a change that came from another source.
This is an attribution challenge, not evidence that automation had no effect. Where practical, use matched processes or a phased rollout to compare similar work under different conditions. If that is not feasible, use a carefully defined baseline and record concurrent changes so decision-makers can interpret results with appropriate caution. Measuring the impact of automation on productivity starts with a fair comparison, then traces what changed across the operation.
Which metrics reveal automation’s real productivity impact?
No single indicator can show whether automation has improved the operation. Throughput can rise while quality falls; cycle time can shrink while queues build elsewhere. When measuring the impact of automation on productivity, pair an output measure with indicators that reveal availability, quality, labour use, and the resources needed to sustain performance.
How should teams measure output, time, and quality?
Define output in a consistent, useful unit, such as conforming units per operating hour. Measure cycle time across the process boundary, not only the automated task, and track queueing, waiting, and downstream delays to see whether time savings carry through to completion. The automation implementation metrics guidance from MHI can help teams consider practical measures such as throughput and labour alongside their own operational objectives.
| Metric | Definition | Possible data source | Limitation |
|---|---|---|---|
| Throughput | Completed, conforming units per operating period | Production records or system logs | Can conceal defects or a change in product mix |
| Cycle time | Elapsed time to complete a defined process or task | Time stamps, PLC or SCADA records, or observation | May omit queues and downstream waiting |
| Availability | Time equipment is available for planned operation | Equipment and downtime logs | Doesn’t show whether available time produces useful output |
| Quality and rework | Conforming output, defects, and work requiring correction | Inspection, quality, and rework records | Quality criteria must remain consistent between periods |
| Labour hours | Time spent on the process, including support and recovery | Task records, rosters, and work observations | Headcount alone won’t show redeployment or shifted work |
Track first-pass yield, the share of output meeting requirements without rework, alongside speed. A faster process that creates more corrections may not improve useful output.
How do availability, labour, and cost complete the picture?
Interpret equipment output against both planned and unplanned downtime. A robot or automated storage and retrieval system may perform effectively while running, yet interruptions can constrain results across the full operating period. Record labour by task, including monitoring, replenishment, troubleshooting, and recovery. If staff move to other valuable work, capture that redeployment rather than treating productivity as headcount reduction alone.
Overall Equipment Effectiveness (OEE) can offer a diagnostic view of equipment performance and losses, but it is not a complete business case. It may not capture downstream effects, support workload, or total operating costs. Separate operating costs from support costs, and compare them using your organization’s verified records. Don’t assume savings or payback from output figures alone. Before using OEE formulas or sector comparisons, verify the definitions and scope against an authoritative, applicable source.
How can you compare automated and manual performance fairly?
A fair comparison holds the work and conditions as constant as possible. Match process boundaries, product families, operating windows, shift patterns, and quality requirements. For example, comparing an automated cell processing a simple product mix with a manual line handling complex work may make the automated process look faster for reasons unrelated to the technology.
Correlation after deployment does not establish causation. A performance change may coincide with automation without being caused by it. The framework discussed in this assessment of AI’s productivity impact reinforces why measurement design matters when interpreting productivity effects. The strength of the conclusion depends on how well teams account for other changes.
When is a baseline comparison useful, and when is it misleading?
Historical data can provide a useful baseline when operating conditions, process routing, and metric definitions have remained stable. Check whether demand, staffing, input materials, or product mix changed between the baseline and evaluation periods, and document any differences. Seasonal peaks or quieter periods can distort a simple before-and-after result. If conditions cannot be aligned, state the limitation and treat the result as indicative rather than definitive.
| Comparison method | Strengths | Limitations | Suitable conditions |
|---|---|---|---|
| Historical baseline | Uses existing operational records and is straightforward to establish. | Concurrent changes or inconsistent data definitions can weaken attribution. | Stable processes, product mix, and measurement practices. |
| Matched comparison | Compares similar processes or areas operating under similar conditions. | Finding a genuinely comparable process may be difficult. | A similar line, cell, or workflow remains unchanged during evaluation. |
| Phased rollout | Allows teams to observe performance before and after staged deployment. | Timing, learning effects, or changing demand may affect results. | Deployment can be sequenced and outcomes tracked consistently. |
How can a pilot or phased rollout improve attribution?
Where practical, compare a pilot area with a similar process that has not yet changed, or introduce automation in stages. Before deployment, agree on outcome measures, data sources, and observation periods so teams do not select measures after seeing results. A pilot can strengthen the comparison, but it cannot remove every confounder. If major changes cannot be controlled or explained, describe the findings as an association, not proof of cause.
When measuring the impact of automation on productivity, the objective is not perfect experimental control. It is to make the comparison transparent, consistent, and useful for the next operational decision.
How do you build a repeatable automation productivity measurement plan?
A repeatable plan turns operational objectives into an evidence trail that teams can review and act on. Before deployment, decide who owns each metric, where its data comes from, and how exceptions will be recorded. This prevents post-deployment results from being assembled from inconsistent sources or definitions.
What should the baseline and measurement plan contain?
Document the process scope, unit of analysis, metric definitions, data sources, and known exclusions. Set observation windows long enough to reflect normal variation in product mix, shifts, and demand, and record why those periods are appropriate. Operations and engineering teams should agree on review ownership and maintain a change log covering process, staffing, routing, or system changes.
Use this workflow to structure measuring the impact of automation on productivity:
- 1. Set the objective. Identify the operational constraint and the decision the assessment must support, such as whether a process is ready for optimization or expansion.
- 2. Define measures and owners. Select a primary outcome and supporting indicators, then assign a person responsible for each metric and its interpretation.
- 3. Validate the baseline. Confirm units, process boundaries, observation windows, exclusions, and the reliability of pre-deployment records.
- 4. Run the pilot and capture data. Use the agreed definitions and log operating changes, interruptions, and exceptions rather than silently excluding them.
- 5. Analyse and review. Compare results with the baseline, explain material differences, and agree on next steps with the teams responsible for the process.
Data may come from PLC and SCADA records, MES platforms, equipment logs, quality systems, or manual operational records. Check timestamps, missing entries, unit consistency, and whether system events represent the same process stages. For example, a machine cycle recorded in control-system data may not correspond to a completed, quality-approved unit. Clear data capture depends on fit-for-purpose connections between operational systems. Learn more about PLC and SCADA integration services.
How should teams interpret results after deployment?
Compare the agreed measures against baseline values and annotate changes in operating conditions. Keep measured outcomes distinct from estimates, assumptions, and financial projections. A change in labour hours, for instance, is not automatically a realized cost saving. Review shortfalls and unexpected effects with operations and engineering teams to identify tuning needs before proposing broader deployment.
For organizations assessing data capture across control systems, explore PLC and SCADA integration as part of a measurement-ready automation approach.
How should productivity evidence guide the next automation decision?
Measurement becomes valuable when it informs the next operational decision. Use the agreed objectives and comparison results to choose among four paths: optimize the current deployment, extend the pilot, scale it, or reassess the scope. The decision should reflect repeatability, quality, safety, and the constraints recorded during evaluation, not a general belief that more automation is always better.
What should trigger optimization, scaling, or reassessment?
- Optimize when the intended outcome is within reach but evidence points to a correctable workflow, integration, or utilization constraint. Identify the specific issue and measure the effect of adjustments before changing the deployment’s scope.
- Extend the pilot when results are promising but the observation period or operating conditions do not yet support a confident decision. Gather more evidence across relevant product mixes or operating windows.
- Scale when results are repeatable under comparable conditions and quality and safety remain acceptable. Check that the process can support a wider deployment before applying pilot results elsewhere.
- Reassess when outcomes miss agreed objectives or key assumptions have changed. The original bottleneck may no longer be the priority, or the selected approach may not address it.
A result from one process area should not automatically be treated as proof that another area will perform the same way. Recheck the work, constraints, and operating conditions before transferring a decision.
How can solution integration support measurable outcomes?
Start with the constraint the evidence identified, then define technology and integration requirements around it. If repetitive handling is the bottleneck, a cobot may warrant evaluation; process requirements and quality measures should guide that assessment. For an application example, see collaborative robots in the UAE. If internal material movement is limiting flow, consider whether an AMR addresses that constraint and define how movement and downstream effects will be measured. The autonomous mobile robots guide offers a relevant overview.
For control systems or ASRS, define the process boundary, data capture needs, and outcome measures before selecting a solution category. This keeps technology selection anchored to operational evidence. Measuring the impact of automation on productivity should inform integration requirements as well as the scale of deployment.
EdNex Automation supplies and integrates cobots, AMRs, PLC and SCADA systems, and ASRS. Explore EdNex Automation to discuss integration options aligned with the constraint your assessment has identified.
Turn Productivity Evidence Into Your Next Step
Automation delivers operational value when it improves useful output across the process, not simply when a machine completes a task faster. Measuring the impact of automation on productivity starts with a credible baseline, consistent metrics, and a fair comparison that accounts for changes in operating conditions.
Use the evidence to make a deliberate decision: optimize a correctable constraint, extend a pilot when results need validation, scale only when performance is repeatable, or reassess if the original objective is no longer being met. The next technology evaluation should follow the bottleneck your data reveals.
EdNex Automation supplies and integrates robotics and industrial automation systems, including PLC and SCADA integration and automated storage and retrieval systems (ASRS). Discuss your automation measurement and integration needs with EdNex Automation to explore options aligned with your operational priorities. A disciplined measurement approach can make each decision a stronger foundation for sustained productivity.
Frequently Asked Questions
How do you measure the impact of automation on productivity?
Start by defining the process boundary and establishing a baseline, then compare consistent measures such as conforming output per operating hour, cycle time, quality, downtime, and labour hours. Measuring the impact of automation on productivity requires tracking operating conditions and concurrent changes so results can be interpreted fairly. Use several complementary metrics: faster task execution alone may not improve end-to-end productivity if defects, queues, or support work increase.
What is the best KPI for measuring automation productivity?
There is no single best KPI for every operation. Select a primary measure tied to the process objective, such as conforming throughput or cycle time, then pair it with indicators for quality, availability, and resource use. Overall Equipment Effectiveness (OEE) can help diagnose equipment performance and losses, but it should not stand alone as a measure of business productivity or investment value. The right KPI depends on the bottleneck being addressed.
How do you calculate productivity improvement after automation?
Use the same productivity ratio for both periods, such as conforming output divided by a defined resource input, and calculate the relative change: (post-deployment productivity minus baseline productivity) divided by baseline productivity, multiplied by 100. Before interpreting the result, check that units, process boundaries, and operating conditions are comparable. Report the underlying values and limitations, and do not attribute the full difference to automation if other operational changes may have contributed.
How long should you measure productivity after automation?
Measure long enough to capture normal operating variation, system stabilization, and representative shifts or product conditions. There is no universal duration; the appropriate window depends on process variability, deployment complexity, and available data. Define the period before comparing results, and report ramp-up separately from established operation. Extend measurement if unusual downtime, demand changes, or incomplete records could distort the findings, rather than relying on a short or unrepresentative snapshot.
How can you prove automation caused a productivity increase?
Causation is more credible when a stable baseline is combined with a comparable process that has not changed or a phased rollout. Match products, shifts, measurement definitions, and operating periods as closely as practical, while documenting other operational changes. If no suitable comparison is available, report an observed change associated with deployment, disclose possible confounders, and avoid claiming proof. The strength of the conclusion should reflect the quality of the comparison.
Should labour reduction be the main measure of automation productivity?
No. Automation may change task allocation, reduce repetitive work, or allow employees to focus on other activities without reducing headcount. Track labour hours and task mix alongside output, quality, downtime, and support workload. Record whether employees were redeployed, whether new monitoring or maintenance work was added, and how those changes relate to the operation’s objectives. This gives a fuller account than headcount alone and helps distinguish efficiency gains from work shifted elsewhere.